Solar energy facts: a win-win for businesses and the planet
Energy consumption is currently responsible for over 75% of greenhouse gas (GHG) emissions because non-renewable choices have continued to dominate global energy reservoirs for a long time. Adopting renewables can change this course and also bring down energy costs enormously.
Based on findings from the Commercial Building Energy Consumption Survey, in the U.S., energy-related expenses account for approximately 19% of the overall budget for office operations. That means for a building spanning 20,000-square-feet and accommodating roughly 100 employees, the yearly energy costs are estimated at around $34,800.
This does not have to be any more because we have renewable energies. Especially, Solar power has gained enormous attention over the years as an affordable and reliable source.
Gilbert Michaud, an environmental policy professor at Loyola University Chicago explained to CNET that solar energy typically pays their investment costs off in a decade, leaving many years of no-cost electricity afterward.
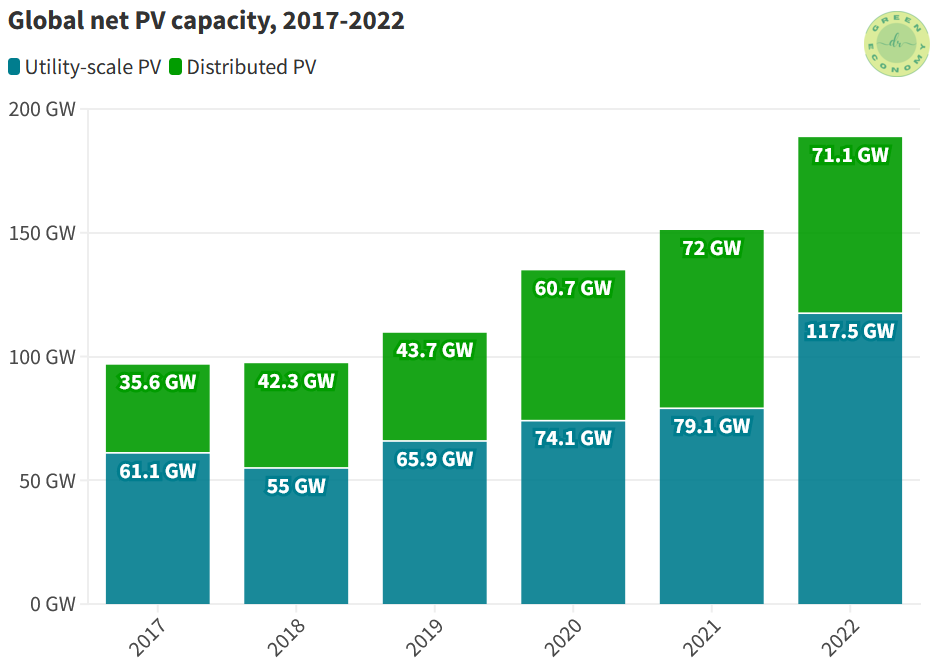
Figure 1 represents the global net PV capacity from 2017-2022. The utility-scale PV remains the most economical choice for new electricity generation in a vast majority of countries. Distributed solar PV, such as rooftop solar installations on buildings has also shown accelerated expansion.
Read: Maximizing energy efficiency with solar-powered windmills
Solar energy facts
In 2022, global installations of new solar capacity reached 239 GW, surpassing the terawatt (TW) scale for the first time. This year is looking equally impressive. By the end of 2023, the world is projected to add 341 GW of new solar capacity to the grid, marking a substantial 43% growth. By 2027, the capacity is expected to reach close to 800 GW.
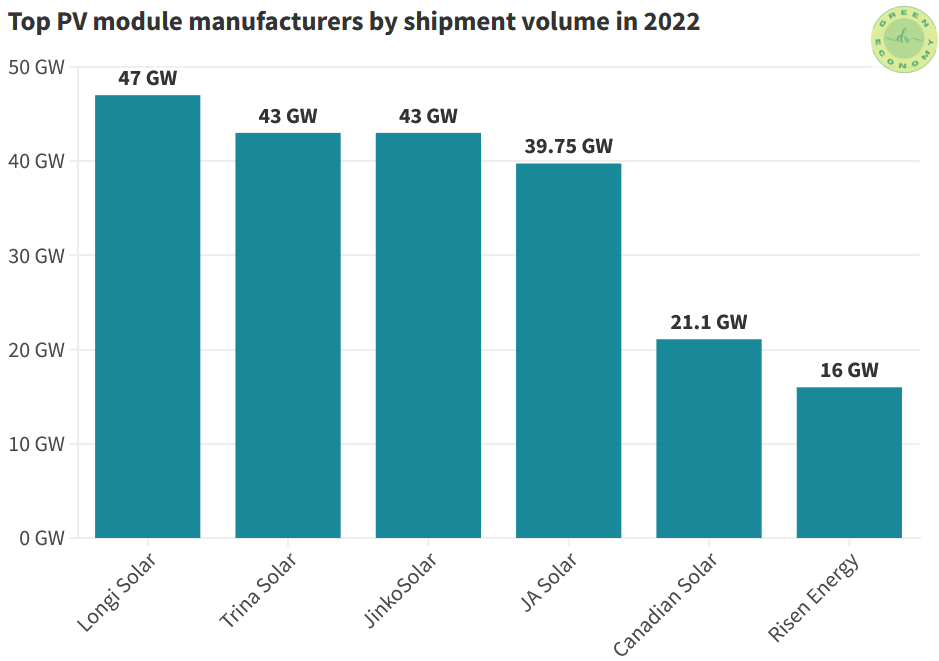
A recent report by TrendForce published that in 2022, the leading six module manufacturers (see Figure 2) collectively shipped between 205 GW to 211 GW of PV panels— i.e. about 76% to 78% of the total demand for modules.
Longi Solar secured the top position with a shipment range of 45 GW to 47 GW, closely followed by Trina Solar at around 43 GW and JinkoSolar at 43 GW.
JA Solar claimed the fourth spot with a shipment volume of 39.75 GW, trailed by Canadian Solar at 21.1 GW, and Risen Energy with 16 GW. All of these major manufacturers are headquartered in China.
Interestingly, solar PV’s installed power capacity is on track to exceed that of natural gas capacity by 2026 and coal by 2027.
How much do solar panels cost?
Solar power is a massive investment for many businesses and its payback period and how much you will save depends widely on the number of solar panels needed, energy consumption, and more. The cost distribution of an installation is shown in Figure 3.
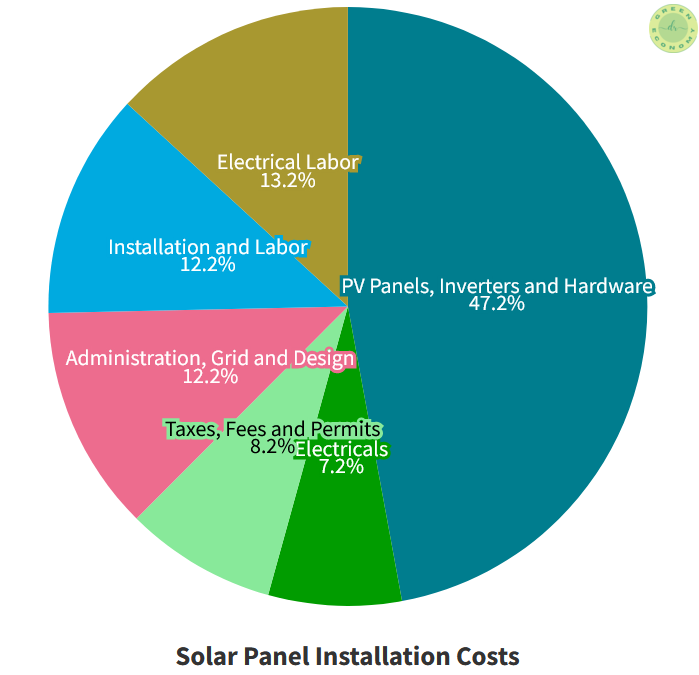
The drawback lies of course in the expensive upfront installation costs that can make solar energy adoption pretty complicated. But the maths shows once you pass the payback period, they can save you a lot for decades.
Solar panels are warranted for 25-28 years typically, but their useful life can be much longer. They offer a compelling choice for maximizing your building's energy efficiency that comes with ease of installation, affordability, and the potential for long-term savings on your electricity expenses.
Read: Wind turbine vs solar panel: which is the ultimate winner?
How to estimate your payback period?
- Calculate your upfront costs, including the cost of panels, electricals, installation, and administration costs (See Figure 3).
- Find out how much tax credits you are entitled to and subtract from upfront costs.
- Estimate your monthly electric bill savings by looking at your bills of at least six months to account for seasonal changes. For example, if you cover 100% of your bill with solar energy and you are currently paying an average of $125 per month in electricity bills, you could save $1,500 per year.
- Once you've figured out your yearly savings, you can calculate your payback period by dividing the net cost of your system by your yearly savings. For example, a system that costs you as upfront costs $15,000 and saves you $1,500 each year, will pay for itself in 10 years. The formula is given below:
Payback period in years = ((Solar installation costs - tax credits) / Annual savings)
Why should businesses switch to solar energy?
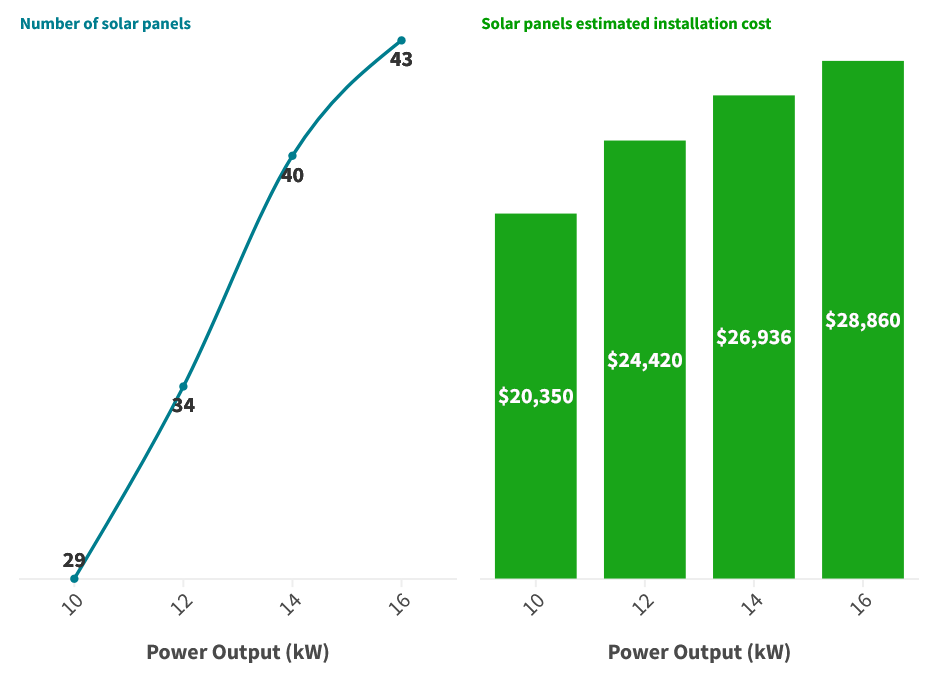
In the U.S., companies and enterprises accounted for an impressive 14% of the total installation of solar panel systems in 2022. Figure 4 shows how many solar panels are needed to deliver different power outputs (left) and how much approximately that would cost for the installation (right).
For the power output of 16 kW, a building needs 43 solar panels and that would cost approximately $28,860. But with the traditional non-renewable option, a 20,000-square-foot building that accommodates roughly 100 employees will pay more than that for energy per year. So, adopting solar means a win-win for businesses and the planet.
An increasing number of businesses have recognized the advantages of solar energy and have leveraged state and federal financial incentives. For example, PUMA adopted 100% renewable electricity for its global operations spanning Europe, the USA, Canada, Latin America, Asia, and Australia in 2020. In 2021, the company achieved an 88% reduction in its carbon emissions compared to the baseline year of 2017.
The solar energy sector is flourishing. For businesses, an investment in the sector provides continuous financial and environmental advantages in the future. With cost-effective pricing and numerous benefits, commercial solar panels are now a feasible energy solution for small to larger corporations and organizations.