Italy to receive €80B for energy transition

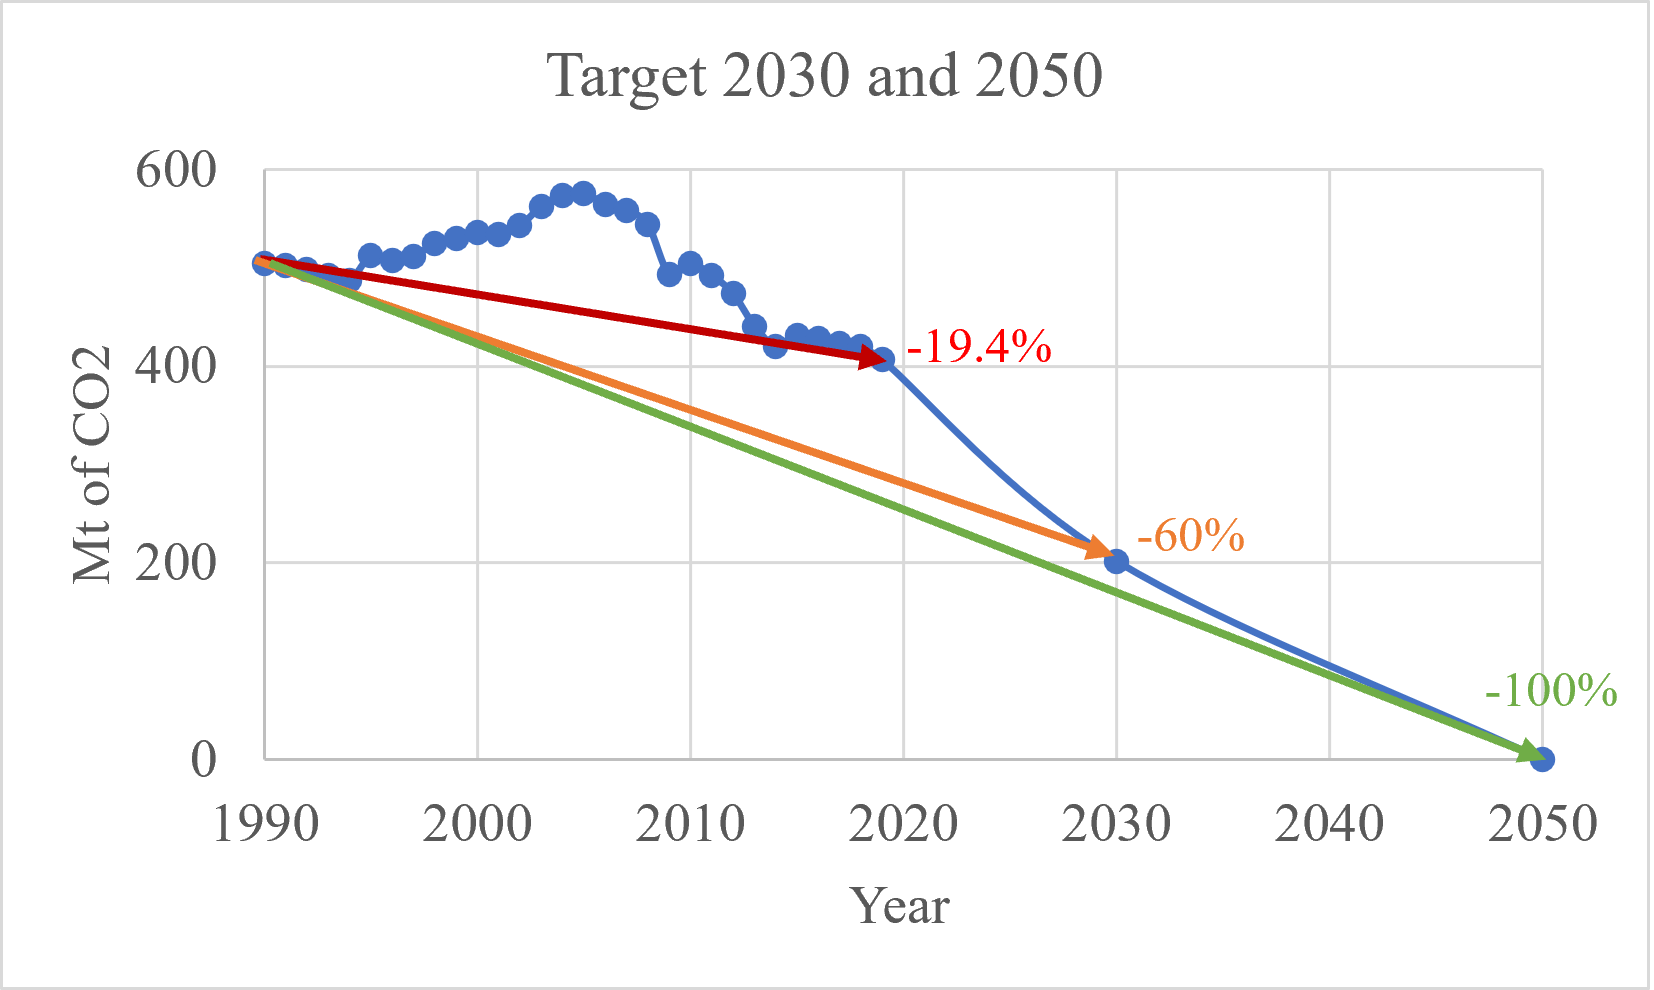
The EU has raised the emission target bar to at least a 55% reduction by 2030 and climate neutrality by 2050. As Italy’s efforts and targets are naturally connected with the EU guidelines, the country aims to cut down its emission by around 60% by 2030 and reach “net-zero” by the year 2050, with the help of €80 billion EU funds for the energy transition.
Greenhouse gas emissions since 1990
Italy is currently responsible for about 11.4% of the EU emissions, taking the second position after Germany. The annual CO2 emission from 1990 to 2020 is shown in Figure 1. Although the emissions increased slightly from 1996 to 2005, they started going down since then.
In 2020, Italy released about 303.82 million tonnes of CO2, and sectors, such as transportation, construction, and industries played a major role in the emission. CO2 accounts for more than 80% of the total greenhouse gas (GHG) emissions, with others being methane and nitrous oxide.
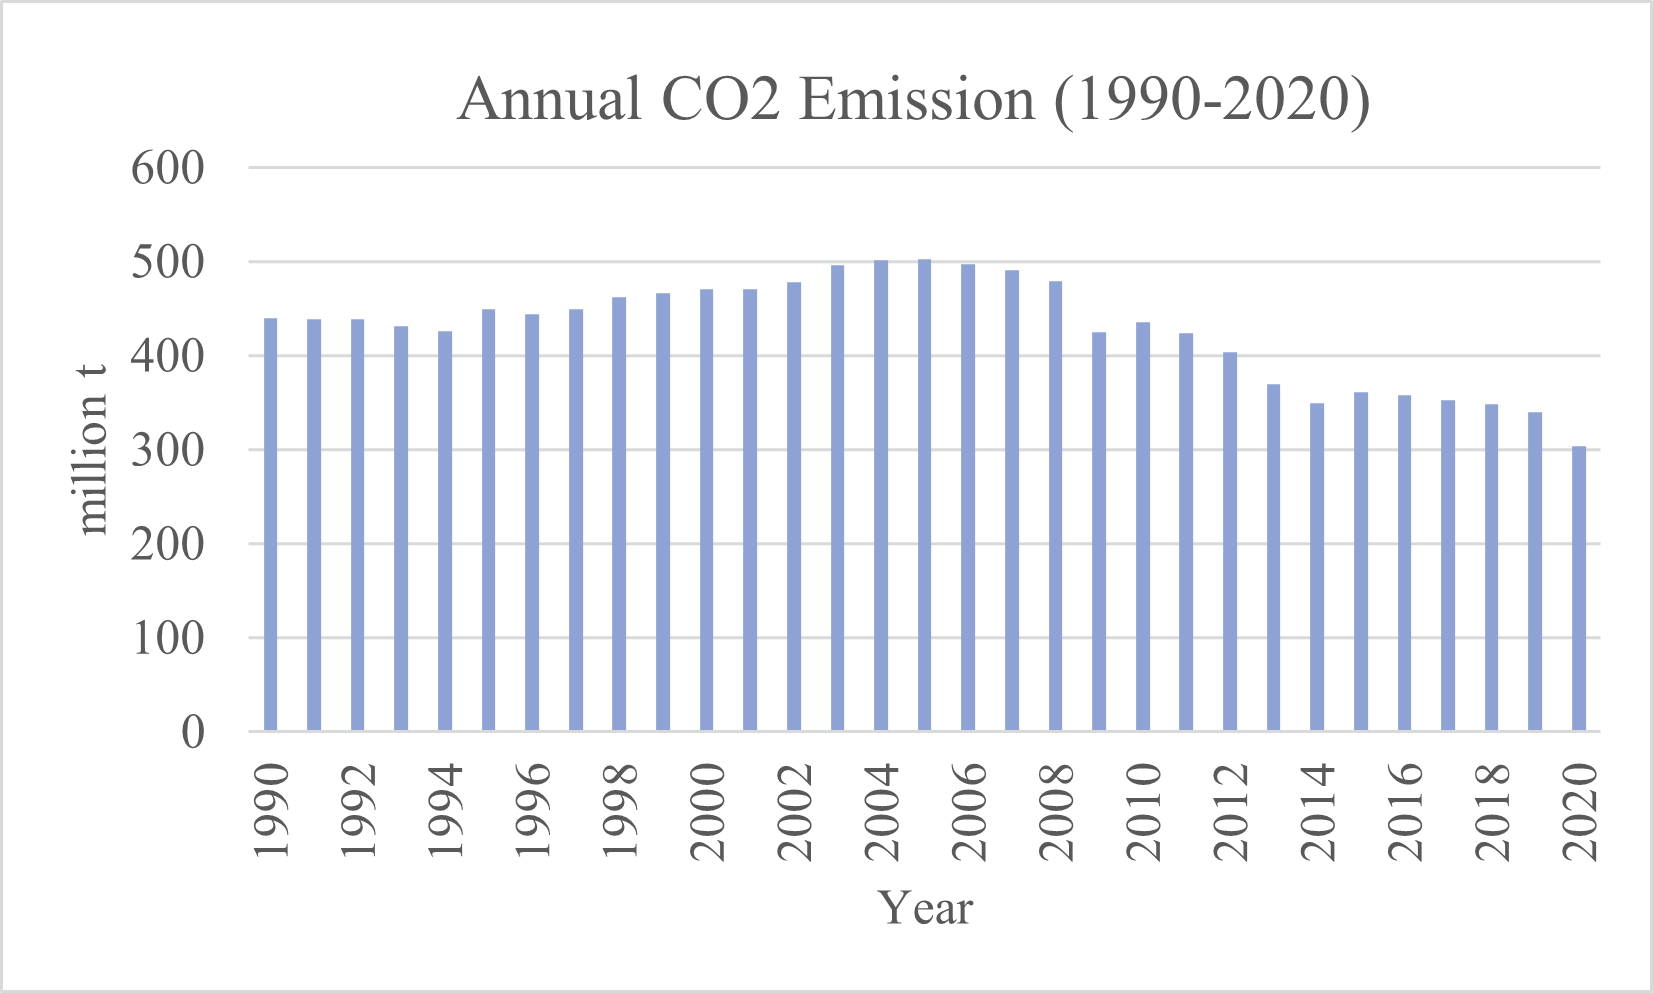
In the year 1990, Italy produced 439.55 million tonnes of CO2, and with other gases combined, 520 million tonnes of GHG were released into the atmosphere. From the year 1990 to 2005, the GHG emission increased significantly, reaching close to 600 million tonnes. After the year 2005, the emission started coming down with significant improvement in renewable energy sectors.
The total GHG from 1990 to 2019 is shown in Figure 2. According to this article, Italy managed to reduce about 19.4% between 1990 and 2019. Figure 1 and Figure 2 have shown identifiable similarities as the GHG emissions increased with the increase of CO2. It is expected as CO2 takes the share of more than 80% of GHG emissions.
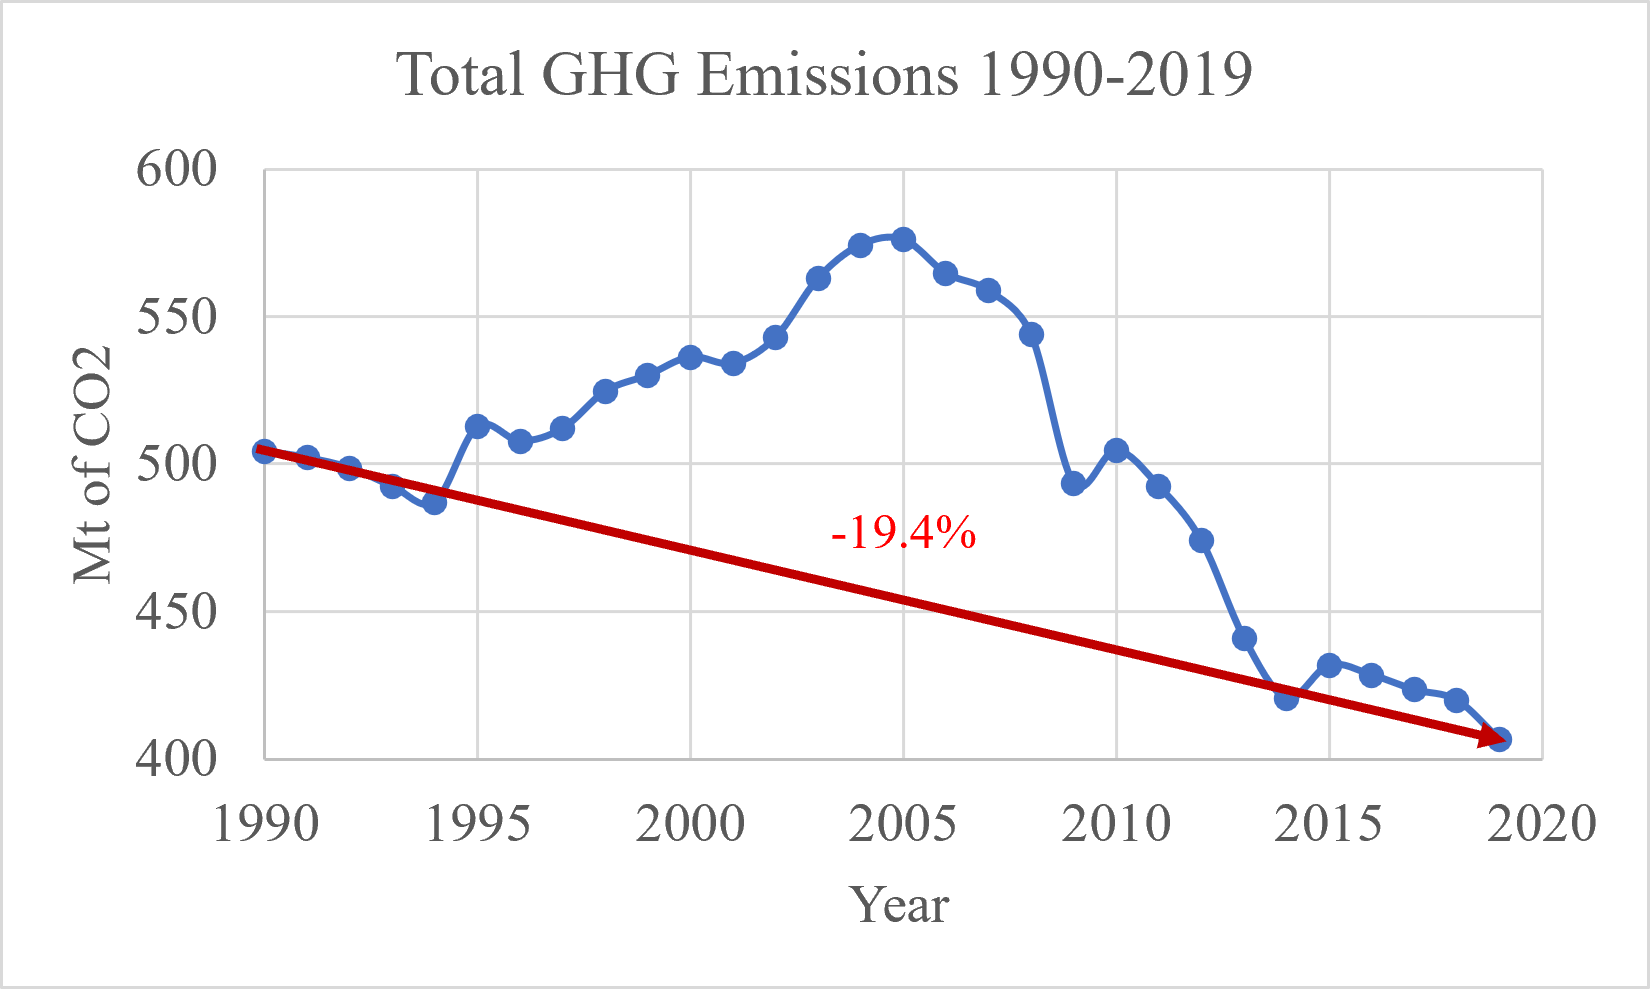
The data for the year 2009 shows that only 493.53 million tonnes of GHG were produced that year, which is a good improvement within four years. The emission slightly increased to 504.54 million tonnes in 2010 and then started trending down until the year 2014, marking 420.63 million tonnes in that year.
After a slight increase in 2015, the emission again came down gradually to 406.49 million tonnes in the year 2019. Methane and nitrous oxide have remained almost constant throughout the year, and the decrease in total GHG emission is due to the reduction in CO2 emission.
Countdown to 2030 and 2050
With a decrease of 19.4% in emissions from the year 1990 till 2019, Italy’s trend is still above the EU average and can be taken as a significant improvement. However, the next eight years are very crucial and ambitious. To cut down the emissions by 60% by 2030 and reach net-zero by 2050 could be a huge challenge. Italy has to reduce about 300 million tonnes by 2030 to meet the 60% target.
Energy share (1990-2020)
After Germany, France, and the United Kingdom, Italy is Europe's fourth-largest energy consumer. The total energy supply from different sources from 1990 to 2020 (recorded every five years) is shown in Figure 4. The total energy consumption in 2020 was about 5.66 million TJ, which was reduced by almost 9% compared to the year 2015.
Oil and natural gas dominate Italy's primary energy consumption, accounting for more than 75% of overall consumption only in 2020. As shown in Figure 4, the total energy consumption of Italy declined rapidly every year from the year 2005. Electricity consumption per capita was approximately 4750 kWh in 2020, which is 11% less than the EU average.
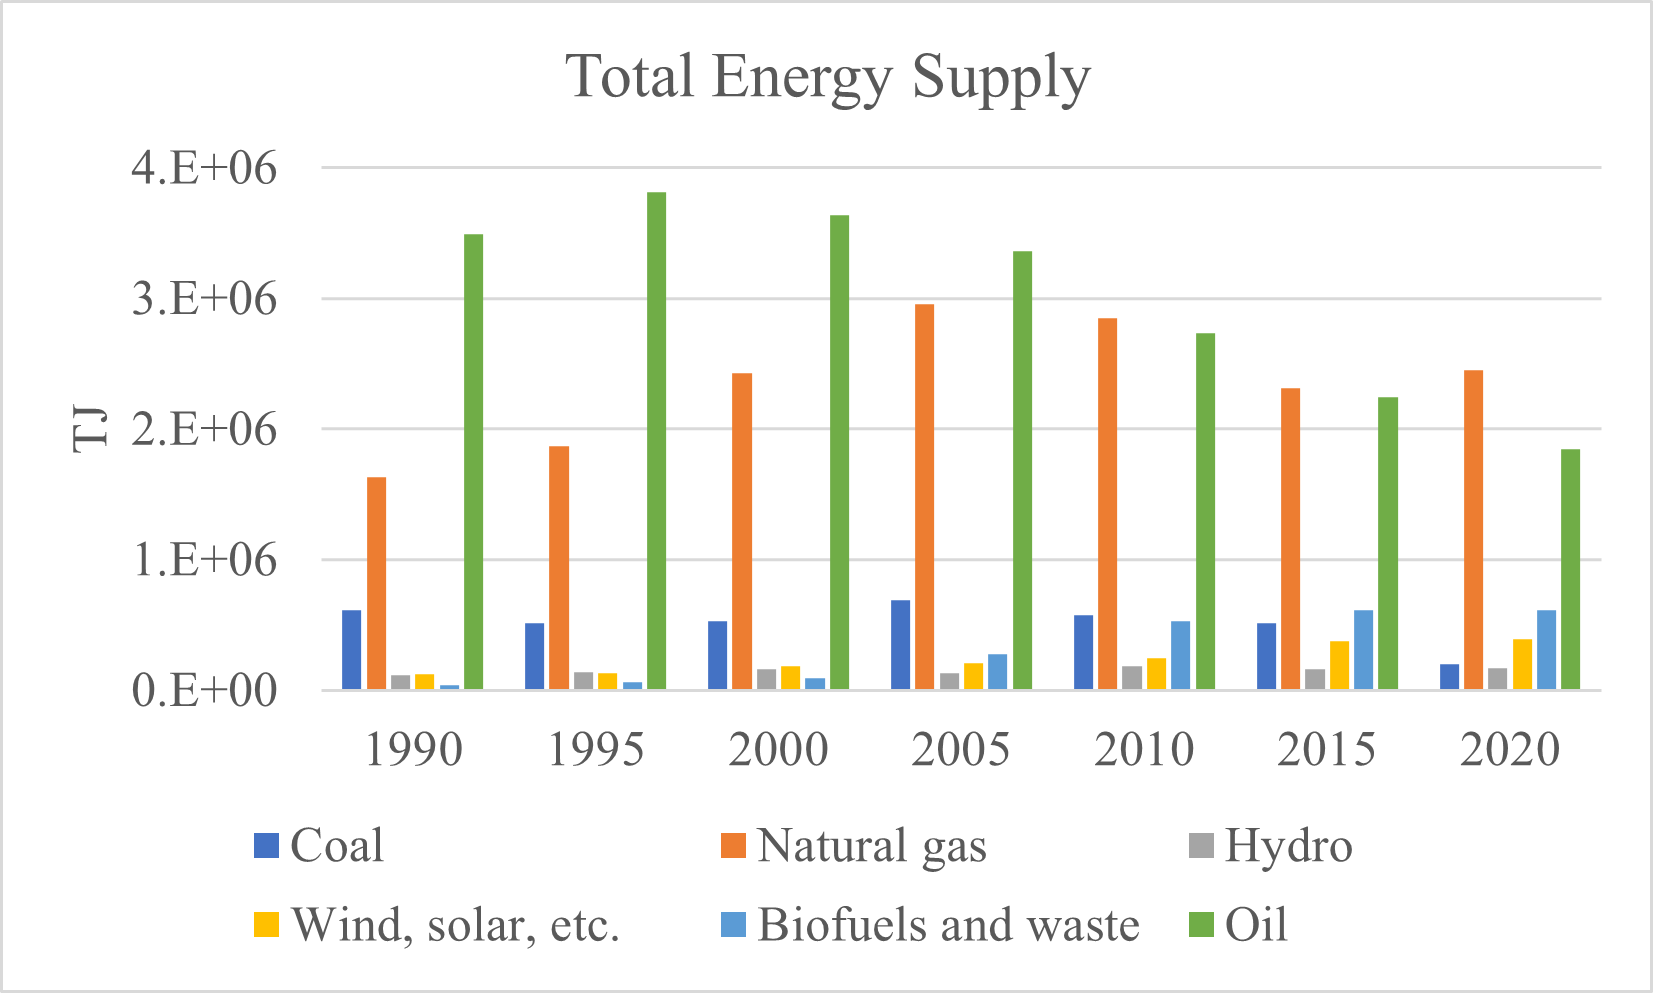
According to Our World in Data, the highest emission, about 43% came from the use of natural gases, the majority of it used in production processes and household uses. Oil is the most used source for energy generation in transportation, which contributed to about 33% of the emission. The transportation sector alone is responsible for more than 100,000 gigagrams of CO2 equivalent every year.
Coal, mainly used for household and small production processes, contributed about 3.5% of the emission. Domestic oil output climbed by 28% in 2020, covering around 10% of the country's demand. About 34% of electricity in Italy is being generated by renewable energy sources, which significantly improved from the year 2014. About 7.2% of energy for transportation also comes from renewable sources.
“We plan to install 40-gigawatt hours of renewable energy in the country to accelerate decarbonization by 2050,” said Italy’s Minister for Ecological Transition Roberto Cingolani.
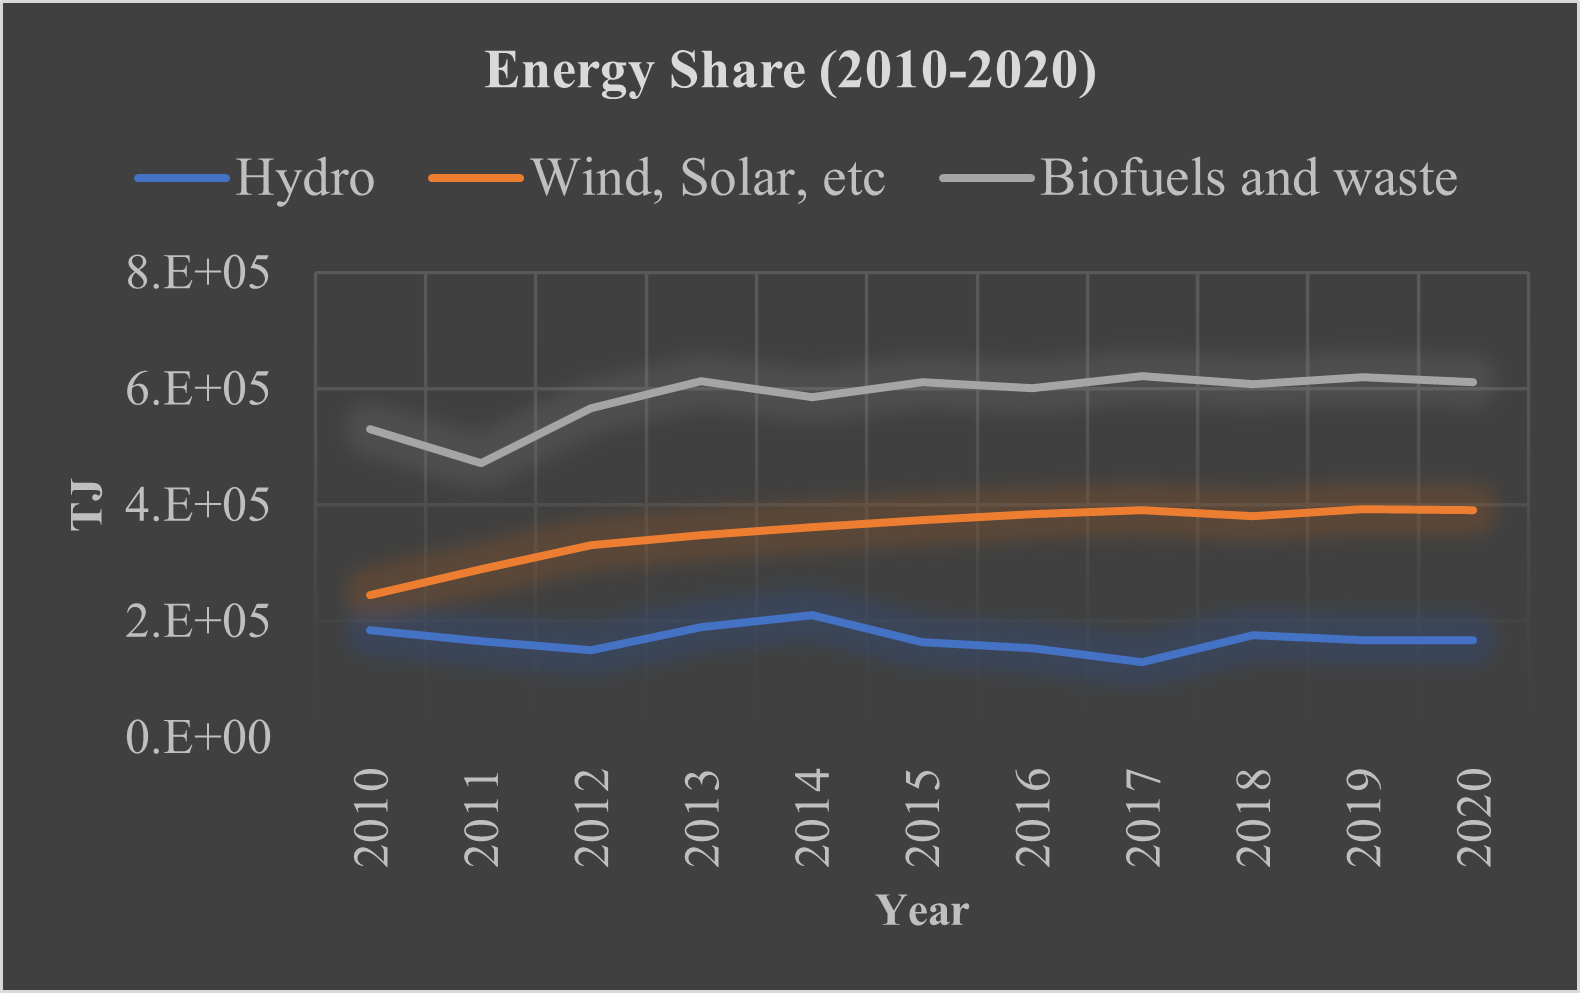
About 20% of the country’s energy was produced from renewable sources in 2020, among which biofuels and waste topped the chart. As shown in Figure 5, the use of wind, solar, etc. is seen increasing gradually from 2010 to 2020.
However, the 20% share from renewable energies is still considered very low. With €80 billion in funds for the energy transition, which has encouraged the country to plan to install 40 gigawatts hours of renewable energy, Italy’s movement will be under close observation in the next five years.

