Heat wave grips Europe: Climate crisis intensifies
Last week, most parts of Central and Western Europe were punished with an unbearable heat that used to be normal only in August, just a few years ago. France, Germany, Spain, Poland, and Austria were some of the countries that fought against the peak temperatures above 104°F (40°C).

The planet will survive, it’s the human who will not
Last week, most parts of Central and Western Europe were punished with an unbearable heat that used to be normal only in August, just a few years ago. France, Germany, Spain, Poland, and Austria were some of the countries that fought against the peak temperatures above 104°F (40°C).
Rising temperature is one of the indications that climate change has occurred. According to IPCC, human-induced climate change has been disturbing the polar jet stream, resulting in high intensity and frequency of certain types of weather and climate extremes, such as wet, dry, long, and intense heat waves.

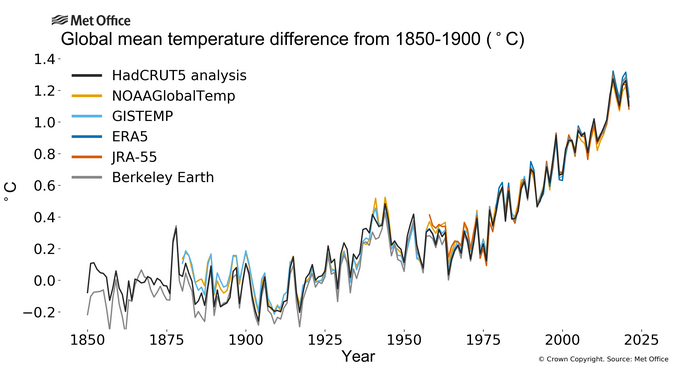
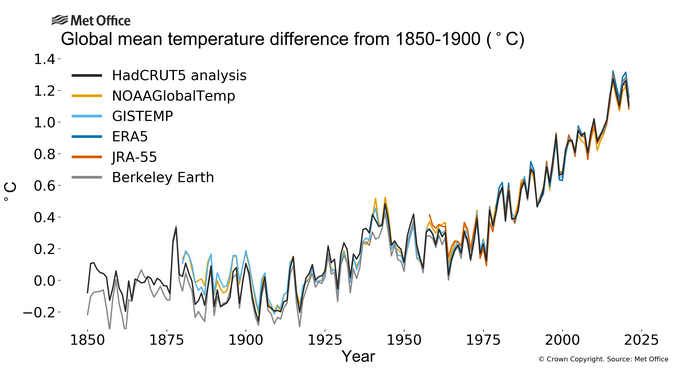
The Paris Agreement chases to keep the global average temperature below 1.5°C from pre-industrial (1850-1900) levels. Figure 1 demonstrates the yearly global average temperature from 1850 to 2021, which shows a steady increase after 1975. In 2021, the global average temperature was 1.11°C— nearly approaching the limit. The year is remembered for a record-shattering temperature of nearly 50°C in Canada, drought in parts of Africa and South America, and the deadly flooding in Asia and Europe. This steady increase in temperature has been popularly attributed to the rise of global greenhouse gas emissions (GHG).

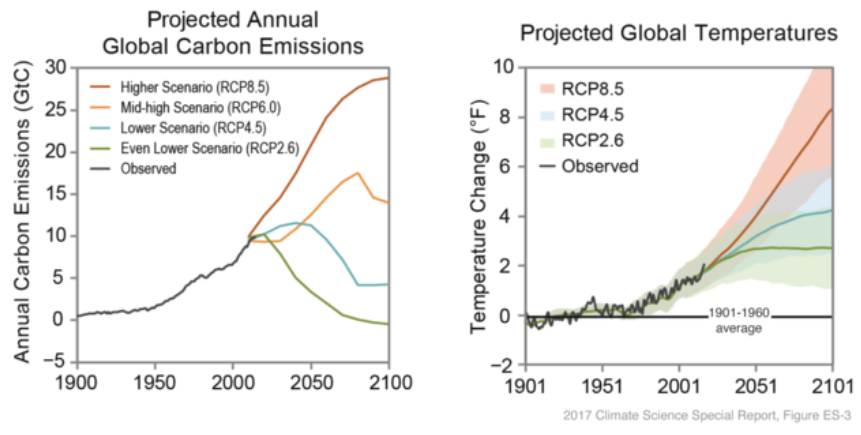
In 2017, a Climate Science Special Report by the U.S. Global Change Research Program compared the rise in the global average temperature with the increase in global carbon emissions. The comparison is shown in Figure 2. As observed, the global temperature increased steadily as the emissions increased around 1975.
Relation between GHG and surface temperature
Climate change is causing global temperatures to rise. GHG released into Earth's atmosphere in large volumes traps the sun's heat, causing the planet to warm and triggering record-breaking heat waves.
As the air gets warmer, it can hold more water vapor and is additionally able to evaporate more liquid water from soils, plants, and oceans, transferring this moisture from ground levels up into the atmosphere. This process makes the high air temperatures and atmosphere more humid.
According to the IPCC’s recently released sixth assessment report, extremely hot days have become more frequent and intense across the world since the 1950s. The hot extremes, including heat waves that used to occur once every 10 years are now occurring nearly three times more, and they are 2.2°F (1.2°C) hotter than they were before pre-industrial levels. These are expected to continue due to record levels of GHG in the atmosphere.
How much the earth will warm in the future will depend on how much GHG we emit in the coming decades. According to the 2017 U.S. Climate Science Special Report, if yearly emissions continue to increase rapidly as now, global temperature will be about 5-10°F warmer than the 1901-1960 average by the end of this century. Even if the emissions begin to decline significantly by 2050, the report projects a temperature rise of about 2.4-5.9°F warmer than the first half of the 20th century.
Remembering the hottest years
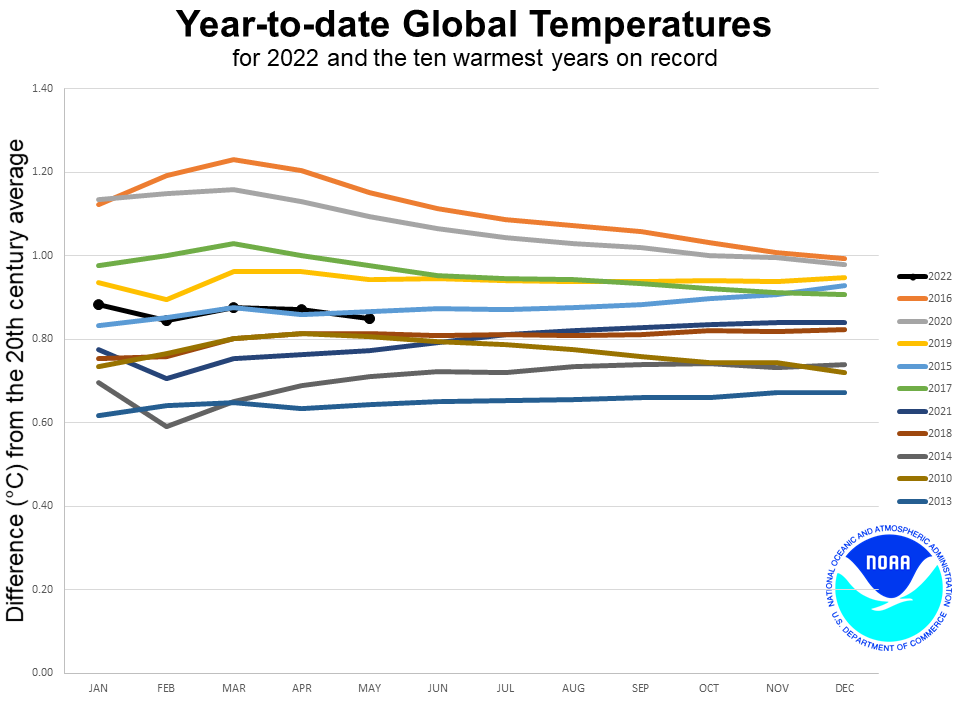
The National Oceanic and Atmospheric Administration (NOAA) has published a graph that shows the recorded temperature difference of the last 10 hottest years above the 20th-century average, compared with 2022 (black line) up to May. As shown in Figure 3, 2016 tops the list of the hottest year recorded, followed by 2020, 2019, 2015, 2017, 2021, 2018, 2014, 2010, and 2013 in descending order.
Looking at the data until May this year, 2022 will compete with 2015 for the 4th place. The average global land and ocean surface temperature for January–May 2022 was 0.85°C (1.53°F) above the 20th century average of 13.1°C (55.5°F).

Although NOAA claims 2021 to be the 6th warmest year, the Copernicus Climate Change Service and the Japanese Meteorological Agency (JMA) rank the year as the 5th and 7th warmest, respectively. Berkeley Earth, NASA GISTEMP, and HadCRUT agree with NOAA and have placed 2021 in the 6th position. These small differences come from the marginal error for calculating the average global temperature.
Heat waves and causes
Heat waves occur when high-pressure systems force air downward, preventing the air near the ground from rising. In such a high-pressure system, air from upper levels of our atmosphere is pulled toward the ground, becomes compressed, and increases temperature by acting as a dome cover that seals off the air underneath from the surrounding atmosphere. The sinking air prevents the warm air from cooling, causing it to get hotter.
The formed dome traps heat that would otherwise rise into the air and cool before circulating back to the surface. The inability of rising not only reduces the chance for precipitation but also allows the continual buildup of extremely hot temperatures, known as a heat wave.
As the high-pressure system seals the area, other weather systems cannot move into it. As a result, a heatwave can last for several days or weeks until it breaks. Whenever the blocking pattern responsible for keeping the high stationary dissolves, the dome of high pressure is released, and will once again push onward and break the heat wave.
Heat waves enormously affect humans and the environment, in the form of droughts, freshwater shortages, wildfire, and the spread of the plague. About 61 million more people in Earth’s urban areas would be exposed to severe drought in a 2°C warmer world than at 1.5°C warming.
Limiting warming to below 1.5°C and removing GHG from the atmosphere to meet the Net-Zero target by 2050 is the only way to save us from all-natural calamities, such as heat waves. Otherwise, the result would be as David Wallace-Wells has written in The Uninhabitable Earth-- "The planet will survive, it’s the human who will not".
Summary
- Last week, central and western European countries suffered from a heat wave
- France, Germany, Spain, Poland, and Austria were some countries affected
- 2016 is the hottest year so far, followed by 2020
- Deadly heat waves show the effect in the form of droughts, freshwater shortage, wildfire, and the spread of the plague


