Carbon dioxide vs Carbon monoxide: how do they affect climate and health?

Carbon dioxide (CO2) and carbon monoxide (CO) are two different gases with different chemical compositions, and properties, as well as their effects on the environment and human health.
Carbon dioxide vs carbon monoxide
Carbon dioxide (CO2) is a greenhouse gas (GHGs) and an immense contributor to climate change. Excessive emissions of CO2 trap heat in the earth's atmosphere, contributing to global warming, sea-level rise, and altered weather patterns.
Although CO2 is not toxic to humans in typical atmospheric concentrations, high concentrations in a poorly ventilated area can deplete oxygen levels, causing headaches, dizziness and difficulty breathing.
Carbon monoxide (CO) is a colourless, odourless, and tasteless toxic gas. It is generated when fuels like wood, petrol, coal, natural gas, and kerosene undergo incomplete combustion. This gas negatively affects the quality of the air we breathe.
Inhalation of an excessive amount of CO results in its binding to haemoglobin in red blood cells, reducing the blood's ability to carry oxygen. This causes symptoms, such as headaches, dizziness, nausea, and confusion, and in severe cases, it can be fatal.
Global CO2 emissions from fossil fuels
According to the data presented in Figure 1, the worldwide emissions of CO2 from fossil fuels and industrial activities reached 37.5 billion metric tons (GtCO2) in 2022.
The chart provides a visual representation of cumulative global emissions from 1970 to 2022.
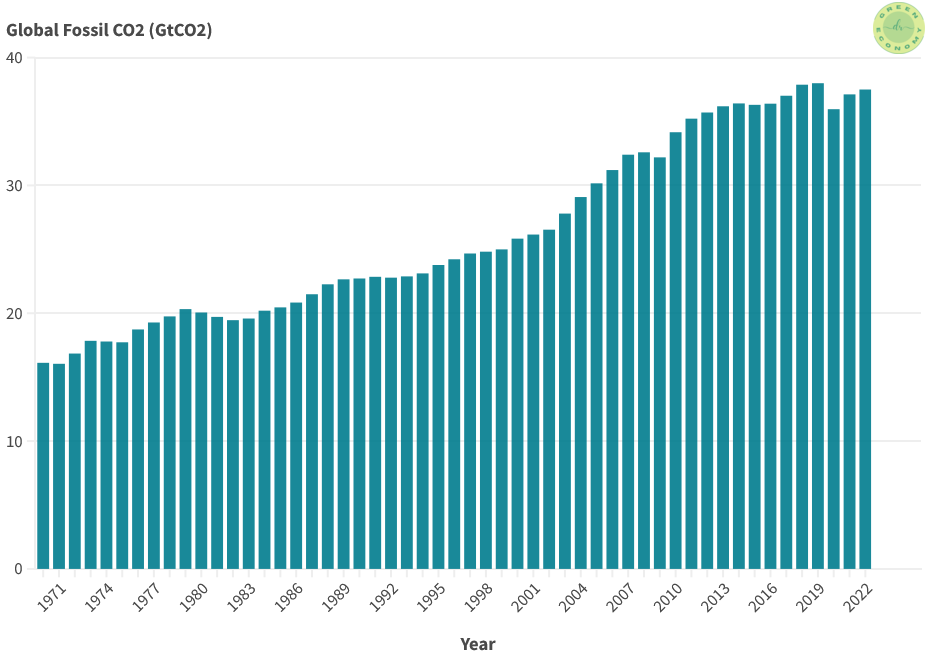
The year 2019 recorded the highest level of emissions amounted to 37.99 GtCO2. From 1970 to 2022, global CO₂ emissions have witnessed an approximate 60% increase.
The outbreak of COVID-19 in 2020 led to a reduction in emissions by around 5%, but this is not the only significant event in history that caused a decline in emissions.
For instance, during the 2009 recession, CO₂ levels dropped by two percent, and a similar notable impact on emissions occurred during the recession in the early 1980s.
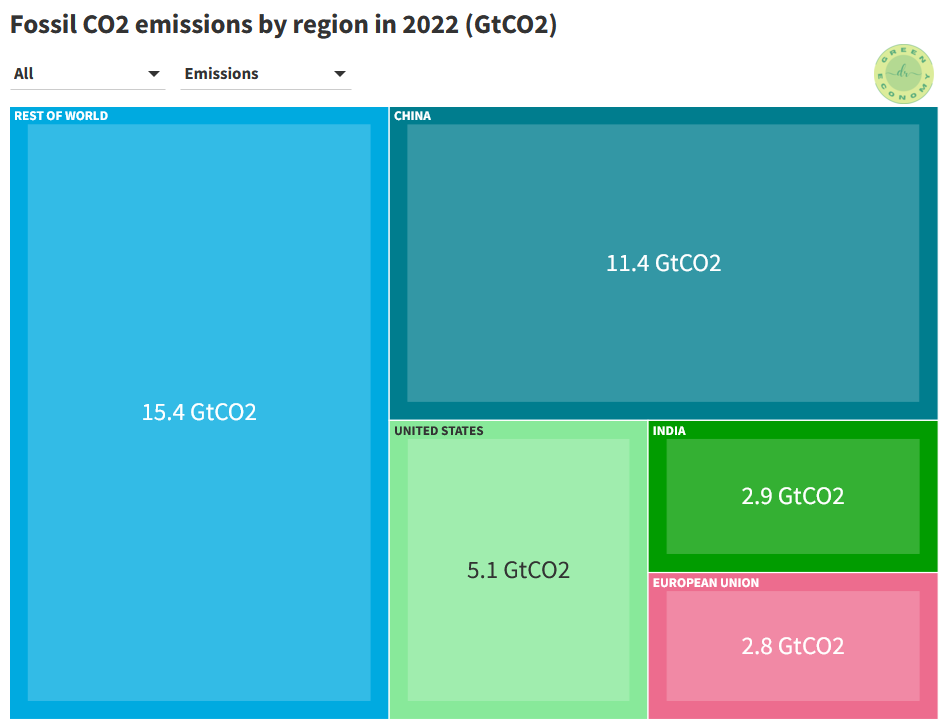
China and the United States (US) are the two largest contributors to global emissions, with emission figures of 11.4 and 5.1 GtCO₂, respectively in 2022.
Biggest emitter of global CO2 emissions in 2022
The treemap chart in Figure 2 compares China, the US and India as the top three emitters, with the European Union (EU) and the rest of the world in 2022. China, being the highest emitter measured about 11.4 GTCO2, while the US emitted about 45% of that amount.
India and the EU emitted 2.9 GtCO2 and 2.8 GtCO2, respectively whereas the rest of the world remained around 15.4 GtCO2.
Where have CO2 emissions increased over the time?
The substantial increase in emissions can be attributed to the economic progress of nations worldwide.
Looking at the emissions of China, India, the US, and the EU from 1970 to 2022 (Figure 3), China did not always hold the position of the world's largest emitter.
However, rapid economic growth and industrialization in recent decades have pushed China's emissions. As a result, between 2000 and 2022, CO₂ emissions surged by over 200%.
India experienced a steady growth rate during this period. In contrast, CO₂ levels in the US have decreased by more than 15% over the same time frame.
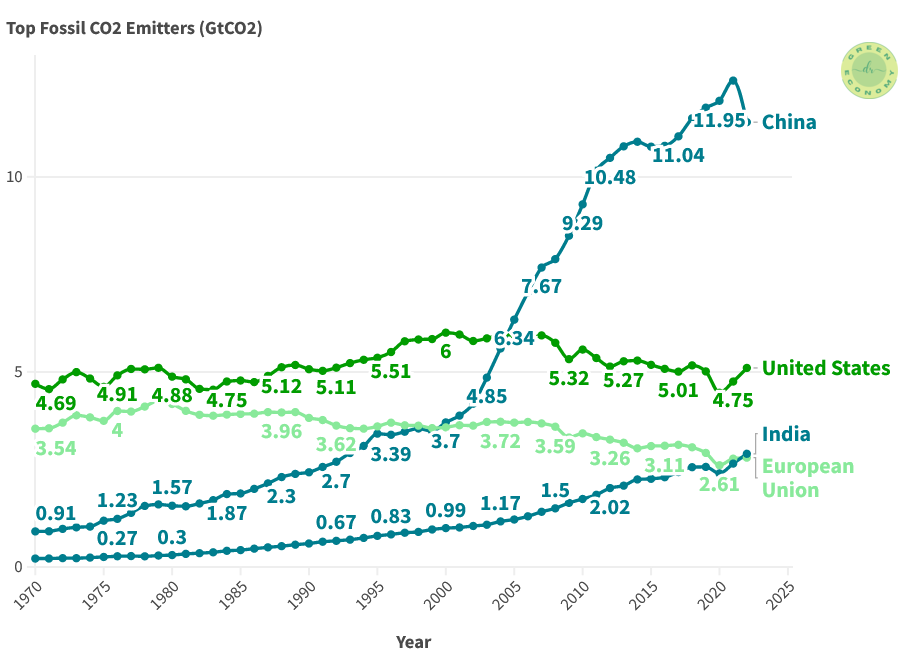
From a longer-term perspective, fossil CO2 emissions in the EU have shown a decreasing trend since around the 1980s and in 2022 they settled down with 2.8 GtCO2. That is the best record in the group of decreasing more than 22% in the same period.
During COVID-19 in 2020, although there were improvements as a result of lockdowns and other restrictions, all of them increased their fossil CO2 emissions in 2021 compared to 2020, with India and the US having the largest increases in relative terms (8.3% and 6.5%, respectively).
China’s emissions fell down again in 2022 due to minimization in industrial construction and further strict COVID-19 lockdown.
Read: Transportation emissions dropped due to COVID-19
Sources of carbon monoxide (CO)?
On a global scale, the environmental impact of CO is not considered significant. However, it can contribute to the formation of harmful ground-level ozone during the summer months or undergo oxidation to become CO2.

Figure 4 illustrates the estimated sources of CO emissions as determined by a research team. The majority of CO emissions (56%) originate from on-road vehicles, followed by 22% from non-road vehicles and engines. Fuel consumption and industrial processes account for 6% and 4%, respectively.
Carbon monoxide is decreasing
Data collected by NASA's Terra satellite, as shown in Figure 5, indicates a decline in CO levels by approximately 15% since 2000 due to the popularity of clean technologies in recent decades.
In the figure, areas painted in yellow indicate minimal CO concentrations, while progressively higher concentrations are represented by orange and red colours.
The white gaps in data representation around 2009 and between 2001 and 2002 indicate periods when data was unavailable.
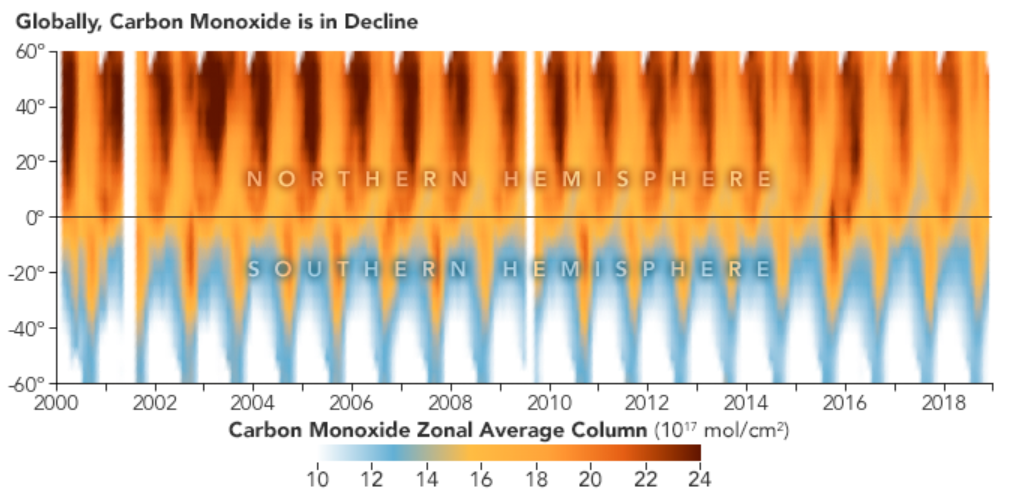
CO levels throughout the year tend to be higher in the Northern Hemisphere, where landmasses, population density, and fire occurrences are more prevalent compared to the Southern Hemisphere.
This alteration in the atmosphere contributes to rising land and sea temperatures, leading to changes in ecosystems, heightened storm activity, and the occurrence of other extreme weather events.
Summary
- Carbon dioxide (CO2) is a greenhouse gas that contributes significantly to climate change
- Carbon monoxide (CO) is a toxic gas produced by incomplete fuel combustion
- Global CO2 emissions from fossil fuels were approximately 37.5 billion metric tons (GtCO2) in 2022
- CO2 emissions have increased by about 60% from 1970 to 2022
- China and the United States are the two largest CO2 contributors with emissions of 11.4 and 5.1 GtCO2 in 2022, respectively
- Reductions in CO levels have been observed in last decade due to increase in clean technologies
